| Главная » Файлы » After Effects Infographics |
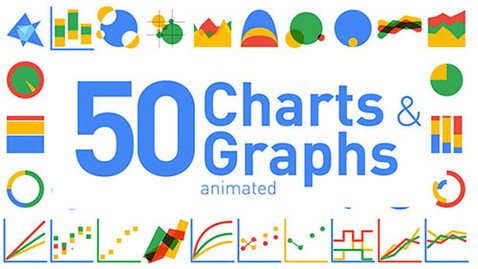
50 Animated Charts & Graphs - Project for After Effects (Videohive)
| 19.10.2016, 12:03 | |
| 50 Animated Charts & Graphs - Project for After Effects (Videohive)
After Effects Version CC 2015 | Resizable | 30 August 16 | No plugins | 15MB Demo 50 fun animated charts and graphs ready to drop into your After Effects projects. All charts and graphs made from shape layers so you can easily resize up or down. Easily change the color scheme for the entire project from one color control comp! Plus there are 10 comps you can edit the animation value of the bar, pie or area chart and the animated numerical value will also change. Скачать | Download turbobit.net uploaded.net | |
| Просмотров: 256 | Загрузок: 0 | | |
| Всего комментариев: 0 | |


